I have a product idea to use artifical intelligence to create audio descriptions for film and television. It was a winner at USC’s Entertainment Technology Center’s Immersive Media Challenge.
Here is the 3min pitch, it includes a section of The Lion King which maybe I will get asked to remove due to rights, but its just a concept so hopefully not!
Here is the link to my presentation from January 2020, which is about ten minutes long and is a pre-viz, to help convey what the world would be like if my product was live. I presented this live like a TED Talk but this is the narrated version. The capability would take some years to develop but well worth pursuing.
Playing around with Python and Keras to create a fashion image classifier
I. INTRODUCTION
Those who shop for fashion online know the frustration of searching and trawling through multiple sites looking for something in particular, and when you finally do find it, it’s out of stock in your size, and you must start all over again.
I dream of one day selling my search plug-in to Google to find and curate clothing from online sites that are in stock, are the right size, are in my budget, and all the other factors that I’m searching for.
To enable this, I would build a tool that uses search terms, and/or an image or a description of the item and it will search the web for me.
This project is a prototype to see how one would go about doing this, and whether machine learning makes it at all feasible.
Focusing on the image recognition aspect of the problem, I have built my own fashion data set from searching the internet and built and tuned machine learning models (convolutional neural networks (CNNs)) to see which works best for finding the images I am searching for.
My proposal comes about from a desire to solve a personal pain point, as I am a prolific online shopper. I’ve recently been encouraged by Google’s own product development for Google Search. Whenever people perform searches regularly, Google eventually brings out a specific tool for each kind of search, such as directions in Google Maps, and more recently, the ability to search airlines and book flights and hotels. I hope that this enhanced Fashion Search tool is just around the corner, but in the meantime, I will build my own.
III. OBJECTIVES
The research question for this paper is “what is the best performing Machine Learning solution to accurately classify fashion images?”
The two primary deliverables of this project are:
Creation of a labelled data set for use in my model,
An evaluation of machine learning and deep learning models for Fashion Image classification,
Being a team of one, my instructions for this project as outlined in class by Professor Muslea is to apply 3-5 machine learning algorithm to my dataset, and then experiment to improve the out-of-the-box results.
IV. METHODOLOGY
Due to the availability of online tutorials and documentation, I chose to use Keras with a Tensorflow back end, using Python language to build my data set and models.
The midterm objective was to build the initial small data set and train and evaluate two machine learning models end to end, which I accomplished, and whose methodology and results will be outlined below and in Section V.
The objective of the final paper was to expand the data set to ten classes like Fashion MNIST [1], develop more models, and improve the accuracy of the models, with the benchmark for performance being estimated human accuracy of 95%. Since the initial plan, I decided rather than spend time on routine work such as expanding my dataset to 10 classes, I have instead focused on transfer learning: fine tuning the VGG16 [2] model and the deeper CNN Resnet50[3] to gain practical experience engineering deep learning models.
A. Dataset
1) Creation of the dataset
The creator of Keras, Francois Chollet [4] outlined in the Keras blog an image classification CNN with over 94% accuracy on as little as 1000 images per class. Therefore, my objective was to obtain a minimum of 1000 images per class for my data set.
Initially, I scraped 100 images for each of three classes: Dresses, Pullovers and Shirts.
Unfortunately, the current method I am using has a limit of 100 images [5] per search term.
To bring the data set up to 1,000 images per class, I specified the colors for each search i.e. red dress, blue dress, yellow dress and so on, to work around the limit. The search term was the folder the images were placed in, and once arranged into the 3 classes (dresses, shirts and pullovers), become the class labels.
2) Data pre-processing
The dataset required cleaning as some images were unreadable. Then I utilized data augmentation using Keras Image Data Generation [6] to change the images to bring the total images per class to 1000. If required, in future I could perform web scraping using Selenium web driver [5], or try using Bing Image API to more quickly increase the size of the dataset, which doesn’t have this limitation.
Keras Image Data Generation [6] takes each image and distorts it to create slightly different versions that are still useful for training the machine learning algorithms.
The Keras GitHub page [7] has code to augment the images for the cats and dogs Kaggle dataset, which I have adapted for my data set as show in Figure 1 below.
Fig. 1. Data augmentation using Keras image data generator tool on my dataset
I used Keras flow.from.data function to enable preprocessing these 224 x 224 images into the 255-pixel scale. This function can also augment the images in multiple other ways, such as rotating or shifting the image to enable training on more images even though the dataset is small. After the midterm, I also changed the shape of the image dataset from a 3D to a 2D array to give me access to other code templates for calculating test loss and accuracy, which I was struggling to do in some cases when completing my midterm paper [8].
The other dataset I used is ImageNet [9], [10] indirectly, because both VGG[11] and Resnet 50 [12]are pre-trained on ImageNet.[9], [10]. ImageNet has 1000 classes of images, including items of apparel and at least 1000 images per class.
1) Dataset split
In order to ensure the accuracy of the measurements of model performance, I performed training and validation using two different splits of my dataset. 20% (600) of the images were held back as the test set in both cases. For the remaining 80% of data, I split the training and validation sets 80/20 for the initial VGG16 model, the tuned VGG16 model and the Resnet50 model (outlined in Part B below).
Dietterich [13] recommends splitting training and validation data 50/50, therefore I also ran the VGG16 model (which was the best performing, as will be explained in Section V) using the 50/50 split recommended. This ensures no overlap between the training and validation data because in the first run, 50% is training data, then that same 50% is used as validation data in the second run.
2) Limitations of dataset
The dataset is just three classes: dress, pullover and shirt. These items are quite similar, and there is some mislabeling within the dataset. This has been accommodated within the allowance for 5% error rate.
B. Models
My research question requires the use of a multi-class classification model, and therefore there are certain functions that are useful in this case.
At the time of the mid-term paper draft deadline, I had implemented a basic CNN [14] and also a VGG-16 pre-trained model [11] as shown in Figure1. This was based on code from deeplizard on YouTube [15]. I applied transfer learning from the weights learned by this model on ImageNet data to my Fashion dataset.
Each hidden layer improves the generalizability of the model, and therefore should improve the accuracy on the test set.
Figure 1 Visual Geometry Group VGG16 CNN
After completing the midterm, the results indicated that there was too much bias in my model. Therefore, I took two courses of action to improve the performance. Firstly, I decided to tune the hyperparameters of the VGG16 model, and secondly trial a deeper Resnet50 model [12] with 50 rather than 16 hidden layers (also with pre-trained weights on the ImageNet dataset). These two models were adapted from the OpenCV website and code provided by Mallick [8].
In order to fine tune the models, I applied dropout to the convolutional layers, and changed the learning rate, and as shown in Figure 4 this improved the accuracy significantly. [16]
Resnet50 is a CNN with many more layers than VGG16, however it deals with the vanishing gradient problem that comes from deep layers by applying the identity matrix to allow the gradient to be passed through each convolution [12].
A. Performance Metrics
In order to benchmark model performance, human accuracy is estimated to be 95%. 100% isn’t likely, as the class of some items may be debatable (remember the blue/black vs white/gold dress internet craze?), and there is some mislabeling in the dataset.
In this project, machine learning performance is measured twice.
Firstly, the performance of the model after learning on the training set is measured on the validation set, and the metric used is validation loss (categorical cross entropy) and accuracy. The model is trained over 20 epochs twice. The second time performance is measured is on the unseen test set, and the metric is categorical cross entropy loss and accuracy.
In order to draw conclusions about the accuracy of my model on unseen data in future, I calculated the accuracy range at 95% confidence using t-scores, because the accuracy rate of the entire population is not known [17].
II. RESULTS
1) Midterm results
Parameters and results for the two models I evaluated for the midterm are shown in Figure 4. I had adapted the code for these two models from deeplizard[15]. Through changing the learning rate for the Basic CNN from 0.001 to 0.01, validation accuracy performance improved from basically worse than chance (25% ) to chance 33%. But then it did not change over the epochs, as shown in Figure 2. The same result was visible when I increased the training and validation epochs to 20.
Figure 2 Mid term results
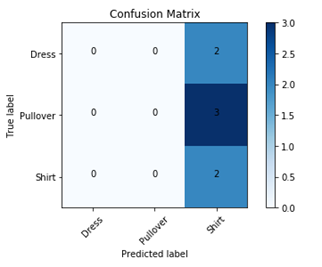
The basic CNN is essentially predicting the same class every time, bias is very high and therefore the accuracy is very low, as shown in the confusion matrix in Figure 3.
Figure 3 Confusion Matrix
The VGG16 model [11] is much more expressive, and by adding the many hidden layers of this convnet which has been pre-trained on 1000 classes of the ImageNet data set, as well as increasing my own dataset from 100 to 1000 images per class, I was able to achieve 78% validation and 76% test accuracy, which is a much better result. VGG16v1 model is likely to achieve accuracy in the range of 72-78% at 95% confidence on an unseen dataset.
Still, there was room to make the model more expressive and bring the results up to 95%.
A. Final Results
The three models I evaluated for the final phase of the project are shown in Figure 4, and a graph of the measurement of validation accuracy for all 2×20 training epochs are shown in Figure 5. Once I had adapted the code from Mallick [8], accuracy for VGG16 immediately improved, up to human level. This code included RMSprop for the optimization function, dropout, and a much smaller learning rate. This was extremely exciting.
VGG16 v2 used the 80/20 split of training and validation data and is likely to achieve accuracy in the range of 85-100% at 95% confidence on an unseen dataset.
VGG16 v3 however split the data 50/50 so training data was significantly reduced, and accuracy reduced accordingly. This model is likely to achieve accuracy in the range of 58-91% at 95% confidence on an unseen dataset.
Resnet50 did not perform as well as the VGG16 models. This model is likely to achieve accuracy in the range of 57-80% at 95% confidence on an unseen dataset.
Basic CNN
VGG16 v1
VGG16 v2
VGG16 v3
ResNet50
Phase
Midterm
Midterm
Final
Final
Final
Train/Dev split
80/20
80/20
80/20
50/50
80/20
Epochs
20
20 x 2
20 x 2
20 x 2
20 x 2
Hidden Layers
1
16
16
16
50
Optimizer function
Adam
Adam
RMSProp
RMSProp
RMSProp
Learning Rate
0.1
.005
2e-4
2e-4
2e-4
Dropout
NA
NA
0.5
0.5
0.5
Activation function
Relu (hidden) SoftMax (final)
Relu (hidden) SoftMax (final)
Relu (hidden) SoftMax (final)
Relu (hidden) SoftMax (final)
Relu (hidden) SoftMax (final)
Loss function
Categorical cross entropy
Categorical cross entropy
Categorical cross entropy
Categorical cross entropy
Categorical cross entropy
Validation test accuracy range with 95% confidence
27-33%
75-78%
85-100%
58-91%
57-80%
Test Accuracy
30%
76%
95%
85%
NA
Figure 4 Final Results
VI. DISCUSSION
Basic CNN with limited inputs and only one hidden layer had high bias and essentially only performed with accuracy at the rate of chance.
A deep CNN like VGG16 is much more expressive, and not been overfit as I conducted training on 60% of the data, utilized 20% of the data for a validation set, and tested on 20%. This can be seen by the closeness of accuracy results of validation and test sets and achievement of human level accuracy of 95%. Adding in dropout to the layers drastically improved performance, as well as changing the optimizer from Adam to RMSprop and reducing the learning rate to a much smaller number (see Figure 4). Perhaps further hyperparameter tuning such as learning rate decay might improve the lower bound of the accuracy confidence interval to above 85%, but given the achievement of human level accuracy, I decided to stop here for the purpose of this assignment. Upon evaluating the errors, it was clear that some classifications are debatable as shown in Figure 5 and 6. Therefore, multiple classes should be assigned to the same image in order for this to work well as a search tool for Google. There was also a repetition of errors through using data augmentation, because when an augmented image was used more than once (with different variations), this multiplied any errors by the same magnitude.
Figure 5 Is this a shirt or a pull over? Difference of opinion in labelling
Figure 6 Is this a dress, shirt or pull over?
However, the Resnet50 model with even more layers surprisingly did not achieve the same level of performance, so this model implementation may benefit from hyperparameter tuning. Again, for the purpose of this project, I did not continue as VGG16 v2 achieved such great results.
The next phase for this project would be to remove all labels and use my Fashion dataset to explore multiclass Active Learning models [18], and possibly utilize the code developed by Google [19]. This could potentially overcome the high cost of manually labelling images with multiple labels, to account for the differences in opinion in what to label an image. My revised target would be to reduce the variability in the confidence interval, rather than 85-100%, I would like to see a minimum of 95% with 95% confidence.
VII. Conclusion
Based on this analysis of machine learning models focusing on convolutional neural networks, the VGG16 model with dropout (v2) performed the best for classifying fashion images in terms of accuracy and is likely to achieve accuracy in the range of 85-100% at 95% confidence on an unseen dataset. This performance is significantly better than VGG16 v1 without dropout, and Resnet50 for this dataset and therefore the likely performance on future unseen datasets. Further work to develop a multi-class active learning model could improve accuracy even more by increasing the lower bound of the confidence interval to a minimum of 95%.
References
[1] H. Xiao, K. Rasul, and R. Vollgraf, “Fashion-MNIST: a Novel Image Dataset for Benchmarking Machine Learning Algorithms,” ArXiv170807747 Cs Stat, Aug. 2017.
[2] “A VGG-like CNN in keras for Fashion-MNIST with 94% accuracy.” .
[7] P. Rodriguez, Accelerating Deep Learning with Multiprocess Image Augmentation in Keras: stratospark/keras-multiprocess-image-data-generator. 2018.
[8] S. Mallick, A toolkit for making real world machine learning and data analysis applications in C++: spmallick/dlib. 2018.
[9] A. Krizhevsky, I. Sutskever, and G. E. Hinton, “Imagenet classification with deep convolutional neural networks,” in Advances in neural information processing systems, 2012, pp. 1097–1105.
[12] K. He, X. Zhang, S. Ren, and J. Sun, “Deep Residual Learning for Image Recognition,” ArXiv151203385 Cs, Dec. 2015.
[13] T. Dietterich, “Approximate statistical tests for comparing supervised classification learning algorithms,” Neural Comput., vol. 10, no. 7, pp. 1895–1923, 1998.
[14] Y. LeCun, L. Jackel, L. Bottou, A. Brunot, and C. Cortes, “COMPARISON OF LEARNING ALGORITHMS FOR HANDWRITTEN DIGIT RECOGNITION,” p. 9.
[15] deeplizard, Create and train a CNN Image Classifier with Keras. .
[16] J. Brownlee, “Gentle Introduction to the Adam Optimization Algorithm for Deep Learning,” Machine Learning Mastery, 02-Jul-2017. .
[17] D. Rumsey, “How to Calculate a Confidence Interval for a Population Mean with Unknown Standard Deviation and/or Small Sample Size,” dummies. .
[18] Y. Yang, Z. Ma, F. Nie, X. Chang, and A. G. Hauptmann, “Multi-Class Active Learning by Uncertainty Sampling with Diversity Maximization,” Int. J. Comput. Vis., vol. 113, no. 2, pp. 113–127, Jun. 2015.
[19] Google, Contribute to google/active-learning development by creating an account on GitHub. Google, 2018.
This post discusses accountability, ethics and professionalism in data science (DS) practice, considering the demands and challenges practitioners face. Dramatic increases in the volume of data captured from people and things, and the ability to process it places Data Scientists in high demand. Business executives hold high hopes for the new and exciting opportunities DS can bring to their business, and hype and mysticism abounds. Meanwhile, the public are increasingly wary of trusting businesses with their personal data, and governments are implementing new regulation to protect public interests. This paper asks whether some form of professional ethics can protect data scientists from unrealistic expectations and far reaching accountabilities.
Demand for DS skills is off the charts, as Data Scientists have the potential to unlock the promise of Big Data and Artificial Intelligence.
As much of our lives are conducted online, and everyday objects are connected to the internet, the “era of Big Data has begun.”(boyd & Crawford 2012). Advancements in computing power, and cheap cloud services mean that vast amounts of digital data are tracked, stored and shared for analysis (boyd & Crawford 2012), and there is a process of “datafication” as this analysis feeds back into people’s lives (Beer 2017).
Concurrently, Artificial Intelligence (AI) is gaining traction through successful use of statistical machine learning and deep learning neural networks for image recognition, natural language processing, and games and dialogue question and answer (Elish & boyd 2017). AI now permeates every aspect of our lives in chatbots, robotics, search and recommendation services, automated voice assistants and self-driving cars.
Data is the new oil, and Google Amazon Facebook and Apple (GAFA) are in control of vast amounts of it. Combined with their network power, this results in super normal profits: US$25bn net profit amongst them in the first quarter of 2017 alone (the Economist 2017). Tesla, which made 20,000 self-driving cars in this time, is worth more than GM which sold 2.5m (the Economist 2017).
Furthermore, traditional industries such as government, education, healthcare, financial services, insurance, retailers, and functions such as accounting, marketing, commercial analysis and research who have long used statistical modelling and analysis in decision making are harnessing the power of Big Data and AI which supplements or replaces “complex decision support in professional settings (Elish & boyd 2017).
All these factors drive incredible demand from organisations, and results in a shortage of supply of Data Scientists.
With this incredible appetite for and supply of personal data, individuals, government, and regulators are increasingly concerned about threats to competition (globally), personal privacy and discrimination, as DS, algorithms and big data are neither objective or neutral (Beer 2017) (Goodman & Flaxman 2016). These must be understood as socio technical concepts (Elish & boyd 2017), and their limitations and shortcomings well understood and mitigated.
To begin with, the process of summarizing humans into zeros and ones removes context, therefore, contrary to popular mythology about Big Data, the larger the data set, the harder it is to know what you are measuring (Theresa Anderson n.d.; Elish & boyd 2017). Rather, DS practitioner has to decide what is observed, recorded, included in the model, how the results are interpreted, and how to describe its limitations (Elish & boyd 2017; Theresa Anderson n.d.).
“All too often, limitations in the data mean that cultural biases and unsound logics get reinforced and scaled by systems in which spectacle is prioritised over careful consideration”. (Elish & boyd 2017)
In addition, profiling is inherently discriminatory, as algorithms sort, order, prioritise, and allocate resources in ways that can “create, maintain or cement norms and notions of abnormality” (Beer 2017) (Goodman & Flaxman 2016). Statistical machine learning scales normative logic (Elish & boyd 2017), and biased data in means biased data out, even if protected measures are excluded but correlated ones are included. Systems are not optimised to be unbiased, rather the objective is to have better average accuracy than the benchmark (Merity 2016).
Lastly, algorithms by their statistical nature are risk averse, and focus where they have a greater degree of confidence (Elish & boyd 2017; Theresa Anderson n.d.) (Goodman & Flaxman 2016), exacerbating the underrepresentation of minorities that exist in unbalanced training data (Merity 2016).
In response, the European Union announced an overhaul of their Data Protection regime from a Directive to the far reaching General Data Protection Regulation. Slated to be law by April 2018, this regulation protects the rights of individuals, including citizens right to be forgotten, and securely store their data, but also the right to an explanation of algorithmic decisions that significantly affect an individual (Goodman & Flaxman 2016). The regulations prohibit decisions made entirely by automated profiling and processing, and will impose significant fines for non-compliance.
Indeed, companies are currently reorganising themselves to protect the data assets they are amassing, reflecting the increased need for data security, ethics and accountability. Two recent additions to the Executive suite are the Chief Information Security Officer and the Chief Data Officer, who are responsible for ensuring organisations meet their legal obligations for data security and privacy.
DS practitioners must overcome many challenges to meet these demands for accountability and profit. It all boils down to ethics. Data scientists must identify and weigh up the potential consequences of their actions for all stakeholders, and evaluate their possible courses of action against their view of ethics or right conduct (Floridi & Taddeo 2016).
Algorithms are machine learning, not magic (Merity 2016), but the media and senior executives seem to have blind faith, and regularly use “magic” and “AI” in the same sentence (Elish & boyd 2017).
In order to earn the trust of businesses and act ethically towards the public, practitioners must close the expectation gap generated by recent successful (but highly controlled) “experiments-as-performances”, by being very clear about the limitations of their DS practices. Otherwise DS will be snake oil, and collapse under the weight of the hype and these unmet expectations (Elish & boyd 2017), or breach regulatory requirements and lose public trust trying to meet them.
The accountability challenge is compounded in multi-agent, distributed global data supply chains, as accountability and control are hard to assign and assert (Leonelli 2016), the data may not be “cooked with care” but the provenance and assumptions within the data are unknown (Elish & boyd 2017; Theresa Anderson n.d.).
Furthermore, cutting edge DS is not a science in the traditional sense (Elish & boyd 2017), where hypotheses are stated and tested using scientific method. Often, it really is a black box (Winner 1993), where the workings of the machine are unknown, and hacks and short cuts are made to improve performance without really knowing why these work (Sutskever, Vinyals & Le 2014).
This makes the challenge of making the algorithmic process and results explainable to a human almost impossible in some networks (Beer 2017).
Lastly, the social and technical infrastructure grows quickly around algorithms once they are out in the wild. With algorithms powering self-driving cars and air traffic collision avoidance systems, ignoring the socio-technical context can have catastrophic results. The Überlingen crash in 2002 occurred because there was limited training on what controllers should do when they disagreed with the algorithm (Ally Batley 2017; Wikipedia n.d.). Data scientists have limited time and influence to get the socio technical setting optimised before order and inertia sets in, but the good news is that the time is now, whilst the technology is new (Winner 1980).
Indeed, the opportunities to use DS and AI for the betterment of society are vast. If data scientists embrace the uncertainty and the humanity in the data, they can make space for human creative intelligence, whilst at the same time respecting those who contributed the data, and hopefully create some real magic (Theresa Anderson n.d.).
So how can DS practitioners equip themselves to take on these challenges and opportunities ethically?
Historically, many other professions have formed professional bodies to provide support outside of the influence of the professional’s employer. The members sign codes of ethics and professional conduct, in vocations as diverse as designers, doctors and accountants (The Academy of design professionals 2012; Australian Medical Association 2006; CAANZ n.d.).
“A profession is a disciplined group of individuals who adhere to ethical standards and who hold themselves out as, and are accepted by the public as possessing special knowledge and skills in a widely recognised body of learning derived from research, education and training at a high level, and who are prepared to apply this knowledge and exercise these skills in the interest of others. It is inherent in the definition of a profession that a code of ethics governs the activities of each profession. Such codes require behaviour and practice beyond the personal moral obligations of an individual. They define and demand high standards of behaviour in respect to the services provided to the public and in dealing with professional colleagues. Further, these codes are enforced by the profession and are acknowledged and accepted by the community.” (Professions Australia n.d.)
The central component in every definition of a profession is ethics and altruism (Professions Australia n.d.), therefore it is worth exploring professional membership further as a tool for data science practitioners.
Current state of DS compared to accounting profession
Let us compare where the nascent DS practice is today with the chartered accountant (CA) profession. The first CA membership body was formed in 1854 in Scotland (Wikipedia 2017a), long after double entry accounting was invented in the 13th century (Wikipedia 2017b). Modern data science began in the mid twentieth century (Foote 2016), and there is as yet no professional membership body.
Current CA membership growth rate is unknown, but DS practitioner growth is impressive. In 2016, there were 2.1M licensed chartered accountants, (Codd 2017), not including unlicensed practitioners such as bookkeepers, or Certified Practicing Accountants. IBM predicts there will be 2.7M data scientists by 2020 (Columbus n.d.; IBM Analytics 2017), predicting 15% growth annually.
The standard of education is very high in both professions, but for different reasons. Chartered Accountants have strenuous post graduate exams to apply for membership, and requirements for continuing professional education (CAANZ n.d.).
DS entry levels are high too, but enforced by competitive forces only. Right now, 39% of DS job openings require a Masters or Ph.D (IBM Analytics 2017), but this may change over time as more and more data scientists are educated outside of universities.
The CA code of ethics is very stringent, requiring high standards of ethical behaviour and outlining rules, and membership can be revoked if the rules are broken (CAANZ n.d.) CAs must treat each other respectfully, and act ethically and in accordance with the code towards their clients and the public.
The Data Science Association has a fledgling code of conduct, but unlike CAs, membership is not contingent on adhering to this code, and there are no penalties for non-compliance (Data Science Association n.d.).
There is another reason comparison with CA profession is interesting.
Like accounting, DS is all about numbers, and seems like a quantitative and objective science. Yet there is compelling research to indicate both are more like social sciences, and benefit from being reflexive in their research practices (boyd & Crawford 2012; Elish & boyd 2017; Chua 1986, 1988; Gaffikin 2011). Also like accountants (Gallhofer, Haslam & Yonekura 2013), DS practitioners could suffer criticism for being long on practice and short on theory.
Therefore, DS should look hard at the experience of accountants and determine if, and when becoming a profession might work for them.
DS practitioners’ ethics should address three areas:
“Data ethics can be defined as the branch of ethics that studies and evaluates moral problems related to data (including generation, recording, curation, processing, dissemination, sharing and use), algorithms (including artificial intelligence, artificial agents, machine learning and robots) and corresponding practices (including responsible innovation, programming, hacking and professional codes), in order to formulate and support morally good solutions (e.g. right conducts or right values).” (Floridi & Taddeo 2016)
It is conceivable that individually, DS practitioners could be ethical in their conduct, without the large cost in time and money of professional membership.
Data scientists are very open about their techniques, code and results accuracy, and welcome suggestions and feedback. They use open source software packages, share their code on sites like GitHub and BitBucket, contribute answers on Stack Overflow, blog about their learnings and present and attend Meet Ups. It’s all very collegiate, and competitive forces drive continuous improvement.
But despite all this online activity, it is not clear whether they behave ethically. They do not readily share data as it is often proprietary and confidential, nor do they share the substantive results and interpretation. This means it is difficult to peer review or reproduce their results, and be transparent about their DS practices to ascertain if they are ethical or not.
A professional body may seem like a lot of obligations and rules, but it could provide the data scientists some protection and more access to data.
From the public’s point of view, a profession is meant to be an indicator of trust and expertise (Professional Standards Councils n.d.). Unlike other professions, the public would rarely directly employ the services of a data scientist, but they do give consent for data scientists to collect their data (“oil”).
Becoming a professional body and adopting a code of professional conduct is one way to earn public trust and the right to access and handle personal data (Accenture n.d.). It can also help pool resources (and facilitate self-employment) so it may open more doors to data scientists, and allow them to pursue initiatives that are altruistic and socially preferable (Floridi & Taddeo 2016).
Keeping ethics at the forefront of decision making actually makes for good leaders who can navigate conflict and ambiguity (Accenture n.d.), and result in good financial results (Kiel 2015).
With the growing regulatory focus on data and data security, it is foreseeable soon that CDO and CISO may be subject to individual fines and jail time penalties like Chief Executive and Chief Financial Officers are with regards to Sarbanes Oxley Act Compliance (Wikipedia 2017c). Professional membership can provide the training and support needed to keep practitioners up to date, in compliance and out of jail.
Lastly, right now, the demand for DS skills far outweigh supply. Therefore, despite the significant concentration in DS employers, the bargaining power of some individual data scientists is relatively high. However, they have no real influence over how their work is used: their only option in a disagreement is to resign. Over the medium term, supply will catch up with demand, and then even the threat of resignation will become worthless.
Data Science Association n.d., ‘Data Science Association Code of Conduct’, Data Science Association, viewed 13 November 2017, </code-of-conduct.html>.
Elish, M.C. & boyd, danah 2017, Situating Methods in the Magic of Big Data and Artificial Intelligence, SSRN Scholarly Paper, Social Science Research Network, Rochester, NY, viewed 19 November 2017, <https://papers.ssrn.com/abstract=3040201>.
Floridi, L. & Taddeo, M. 2016, ‘What is data ethics?’, Phi.Trans.R.Soc.A, no. 374:20160360.
Gaffikin, M. 2011, ‘What is (Accounting) history?’, Accounting History, vol. 16, no. 3, pp. 235–51.
Gallhofer, S., Haslam, J. & Yonekura, A. 2013, ‘Further critical reflections on a contribution to the methodological issues debate in accounting’, Critical Perspectives on Accounting, vol. 24, no. 3, pp. 191–206.
Goodman, B. & Flaxman, S. 2016, ‘European Union regulations on algorithmic decision-making and a ‘right to explanation’’, arXiv:1606.08813 [cs, stat], viewed 13 November 2017, <http://arxiv.org/abs/1606.08813>.
Leonelli, S. 2016, ‘Locating ethics in data science: responsibility and accountability in global and distributed knowledge production systems’, Phil. Trans. R. Soc. A, vol. 374, no. 2083, p. 20160122.
Sutskever, I., Vinyals, O. & Le, Q.V. 2014, ‘Sequence to Sequence Learning with Neural Networks’, arXiv:1409.3215 [cs], viewed 4 November 2017, <http://arxiv.org/abs/1409.3215>.
Winner, L. 1980, ‘Do Artifacts Have Politics?’, Daedalus, vol. 109, no. 1, pp. 121–36.
Winner, L. 1993, ‘Upon Opening the Black Box and Finding It Empty: Social Constructivism and the Philosophy of Technology’, Science, Technology, & Human Values, vol. 18, no. 3, pp. 362–78.
When your community grows so much, you no longer recognise it
In August, I read a Wired story about social media influencers migrating some of their audience to membership sites like OnlyFans and Patreon to get paid for their content: content which is exclusive and risqué and doesn’t meet Instagram and Facebook’s community standards (Parham, 2019). Many influencers complain that Facebooks guidelines are opaque, arbitrary and basically censorship (#freethenipple is a hashtag often used to protest the censorship of women’s bodies (Rúdólfsdóttir & Jóhannsdóttir, 2018)). They are censored not only by the community guidelines but some of their own followers who report them (for an example see @tealecoco, 2019). In response, they migrate some of their audience to sites like OnlyFans. Now I know some theories that explain this situation through my CMGT530 class.
Instagram
is an online community where influencers could express themselves, and fans
interact with each other as well as the influencer. With OnlyFans the
interaction is influencer to one fan or many. Instagram has experienced massive
growth recently, and when influencers have public profiles (nil entry costs),
the influx of new members can dramatically change the community norms (Hirschman, 1970).
Older members do not trust the newer ones (Donath, 1996),
and new ones don’t act in accordance with the unwritten rules of the community (Kim, 2000; Meyrowitz, 1985).
There are as many expectations on the influencer as there are followers due to
the SIDE effects (Walther, 2006),
and there is a lot of conflict and groups regularly splinter off (Jenkins, 2006; Kim, 2000;
Meyrowitz, 1985).
Where once Instagram was perhaps backstage and a safe space for influencers, it
has become front stage (Meyrowitz, 1985)
and behaviours more formal and mainstream. Hence the appeal of OnlyFans.
Nevertheless,
the influencers in the article like to keep their risque OnlyFans persona
separate from their more public Instagram persona, and don’t want the two to
mix. This is explained by Meyrowitz as how we have social situations and roles
in those situations and we feel awkward and uncomfortable if those situations
and roles merge (Meyrowitz, 1985).
Hirschman, A. O.
(1970). Exit, voice, and loyalty; responses to decline in firms,
organizations, and states. Cambridge, Mass: Harvard University Press.
Jenkins, H.
(2006). Fans, bloggers, and gamers exploring participatory culture. New
York: New York University Press.
Kim, A. J. (2000).
Community building on the Web. Place of publication not identified:
Peachpit Press.
Meyrowitz, Joshua.
(1985). No sense of place: The impact of electronic media on social behavior.
New York: Oxford University Press.
Rúdólfsdóttir, A.
G., & Jóhannsdóttir, Á. (2018). Fuck patriarchy! An analysis of digital
mainstream media discussion of the #freethenipple activities in Iceland in
March 2015. Feminism & Psychology, 28(1), 133–151.
https://doi.org/10.1177/0959353517715876
@tealecoco. (2019,
September 22). 𝐄𝐕𝐈𝐋☽❍☾𝐀𝐍𝐆𝐄𝐋
|| Model/Designer (@tealecoco) • Instagram photos and videos. Retrieved
November 10, 2019, from Instagram website:
https://www.instagram.com/p/B2ttjrFp-2a/
Walther, J.
(2006). Nonverbal dynamics in computer-mediated communication or: (And the
net: (’S with you,:) and You:) alone.
https://doi.org/10.4135/9781412976152.n24
This is my reaction to material we discussed in my CMGT530 class at Annenberg: Social Dynamics of Communication Technology. The material was Czitrom (Czitrom, 1982) and the film Devil’s Playground and it’s Amish subjects (Walker, 2002).
The Amish people have a philosophy of Ordnung where they try to slow down or reject technology that may pollute their traditions (Amish America, 2019). Czitrom wrote of the telegram’s impact on macro issues like corporate and government power (Czitrom, 1982). This made me think about today’s technology and how it was used in a murder case in California, described in October 2019 Wired Magazine (Smiley, 2019). It raises the question whether admitting as evidence of data of modern devices puts the underlying tenet of “innocent until proven guilt” in criminal proceedings at risk.
In Wired October 2019 issue, I read about Tony Aiello, a frail 4’11’ Californian in his 90s who died last month in jail awaiting trial (updated in online story) (Smiley, 2019). Accused of brutally murdering his stepdaughter Karen, he died before his guilt or innocence could be determined (Smiley, 2019). A neighbor’s doorbell camera placed Tony at the scene for a crucial 20 min period during which Karen’s Fitbit registered heart rate accelerating and then dropping to none at all. DNA and other evidence led to Tony being put in jail.
I have previously researched how wide DNA database searches and wide facial recognition database searches could lead to coincidental matches (a la the birthday paradox) and false positives, resulting in innocent people having to defend themselves in court and even serving prison time (Keys, 2017). However, this was different, as Tony was a suspect very early on. Nevertheless, device data and expert testimony can be incomprehensible to jury members and also accepted without understanding, even with all its flaws and without establishing motive (Gibson 2017).
With each new technology it’s really important to establish the characteristics of the devices and their data quality before admitting it, if “innocent until proven guilty” and justice is to prevail in our courts in future.
How three forces: the explosion of individual images available online, the accelerating data science capabilities of image processing, and pressure on individual rights and freedoms impact the use of image recognition in surveillance in crime prevention and criminal prosecution. Covers the potential risks of reliance on this kind of visual evidence, and recommendations to reduce these risks to society.
We are living in an “Age of Surveillance”
Surveillance is an age-old tool of crime prevention, and through the analysis of video and still images, provides the basis for prosecution in some cases today for individual and national security crimes. Despite strong lobbying against it, general surveillance by government and corporations has seen an unprecedented increase in recent years (New South Wales et al. 2001). This surveillance occurs at your work place, on the street, in public venues, in supermarkets, at the airport, but also through analysis of what you post publicly on the internet through social media. The ability to conduct surveillance effectively is driven by three forces: the explosion in images available in databases, the image processing capability of data science and the erosion of individual rights. Image Databases are growing exponentially The number of databases with videos and images of people is growing exponentially. Firstly, due to the increased use of CCTV for general surveillance. CCTV has been around since the 1960s, but it has outgrown being closed circuit and on a television, and is now any “monitoring system that uses video cameras .. aimed at preventing and detecting crime through general (not targeted) surveillance. “ (Gibson 2017). Government at all levels use CCTV to deter and detect crime, and its not just fixed cameras but also cameras attached to the bodies of law enforcement agents. Whilst surveillance is an unpleasant fact, many corporations and public-sector organisations gather data on individuals for other purposes, such as marketing, customer service, problem solving, and product development. Individuals often willing consent to the collection of this data, in return for their services. However many individuals do not understand the terms and conditions they are agreeing to when providing their consent (Sedenberg & Hoffmann 2016). Indeed, as our lives are increasingly conducted online, and cloud computing makes storage cheaper, and faster, our activities are tracked, recorded and stored by corporations and governments (Hern 2016; boyd & Crawford 2012; Sedenberg & Hoffmann 2016). As a result of general surveillance and the voluntary provision of images and video over social media, your image is now stored in databases online by governments and corporates. Image Processing capability is growing rapidly also The capability to analyse all these images has made great progress in recent years also, making it possible for machines to process of petabytes of surveillance images to identify individuals. 4 Over the last five years, using deep learning convolutional neural networks (ConvNets), image processing capabilities have progressed from image classification tasks (Krizhevsky, Sutskever & Hinton 2012) using large image databases like ImageNet, to human re-identification using Siamese Neural Networks and contrastive difference to be able to accurately recognise faces they have only seen once before, and in real time (Koch, Zemel & Salakhutdinov 2015; Varior, Haloi & Wang 2016). The YOLO object identification and classification network ( You Only Look Once) are achieving fast processing speeds in real time and competitive accuracy (Redmon et al. 2015). Recurrent neural networks such as long short term memory networks have also proved able to identify objects in video sequences and caption them (Lipton, Berkowitz & Elkan 2015), however this is not in real time. In 2013, Ian Goodfellow developed generative adversarial networks (GANs), where two ConvNets are trained simultaneously, one to generate artificially created images, and the other to discriminate between real images and generated ones (Goodfellow et al. 2014). And in the last two years, both Google and Facetime Artificial Intelligence teams have independently developed the ability to create images using ConvNets (Mordvintsev, Olah & Tyka 2015; Chintala 2015). Lastly, the processing power available to data scientists is growing rapidly, through advancements in graphic processing unit (GPU) speed and the availability of cloud computing, enabling analysis of extremely large data sets without huge investment in compute power. The speed of development is incredibly fast in this deep learning field, and it is very conceivable that products will be developed in the next 10 years that could productionise and scale these automated image recognition and generation capabilities for use by corporations, government and law enforcement for use in surveillance for crime prevention, detection and prosecution. The ready availability of image databases, and the advancements in data science image processing capability is not enough without the right of corporations and governments to use this data for general (not targeted) surveillance). This third force is also increasingly becoming a reality in recent years. Erosion of Individual Rights There are several ways our rights are being eroded. Individual rights to privacy are being eroded voluntarily, as we give away licenses to our own images, and involuntarily through legislation or court decisions enacting crime prevention and national security measures. More images of our daily life are captured through our phones and posted to social media. Technically, you own these images and can control their usage (Wikipedia 2017) (US Copyright Office n.d.; Orlowski n.d.). However, while you own the copyright of the images you have created, you have probably already given Facebook and Amazon permission to profit from your image and images you own, through a very wide-ranging license to store and use it (Facebook n.d.). Private organisations are using the data gathered on their users for research, however these organisations are outside of the ethics required by government on education and health institutions 5 (Sedenberg & Hoffmann 2016). The profit motive of these companies could undermine privacy and security of your data (Sedenberg & Hoffmann 2016). On the personal data level, there are some serious attempts at protecting the rights of the individual. The General Data Protection Regulation of the European Union which comes into effect April 2018, covers all data captured from EU citizens. It codifies the “right to be forgotten”, and “the right to an explanation” for the result of any algorithms (Goodman & Flaxman 2016). However, these regulations do not seem to matter when it comes to national security. However, Edward Snowden and Wikileaks revealed that organisations like Yahoo and Google have been compelled in the United States courts and in Europe to hand over your data to government bodies for national security surveillance (Wikipedia 2018). It is quite feasible that Apple, Facebook and Amazon have the same obligations, and we just don’t know about it yet. The use of video cameras for general surveillance erodes an individual’s right to privacy, which although reduced in public, is still expected to some degree due to people’s perception of the “veil of anonymity” (Gibson 2017). It also indirectly erodes freedom of speech, as people are unable to express themselves without fear of reprisal (Gibson 2017). People often say they have nothing to hide when it comes to fighting against general surveillance, but this is predicated on society and government keeping the same values of today into the future. Once something is recorded online, either in image or text, it is there forever and could be used against you. This is something people from totalitarian regimes would be able to tell Westerners. Having online databases of images and advanced processing power combined with the erosion of individual right to privacy make the perfect conditions for an explosion in the use of image processing in criminal prevention, detection and prosecution. The next section focuses on the current and future use of image processing as a form of visual evidence in criminal prosecution. Uses of Image Processing in Criminal Prosecution Video and images are a form of visual evidence, whose purpose is to provide positive visual identification evidence (i.e it is the same person) , circumstantial identification evidence (i.e it is a similar person) or recognition evidence (I know that it is the same person in the image) that supports the case to prove that the accused is the offender (Gibson 2017). Computer image processing provides visual evidence in a number of ways. Firstly, its sheer processing power enables a very wide and deep search for this evidence within image databases or millions of hours of video. It also has useful capabilities in gathering video evidence. It can detect individuals across a range of different surveillance cameras as the offender moves through the landscape. Algorithms can be used to “sharpen” blurry images. YOLO image recognition can enable a person’s face to be found in a huge database of images using neural network architecture. Variable lighting, recording quality, movement of the camera, obstructions to line of sight, and other factors make for many interpretations of an image (Henderson et al. 2015). For this reason, an expert in “facial mapping” or “body mapping” usually examines the image and testifies in the court room, where they can be cross examined (Gibson 2017). The expert may not positively identify the defendant, so at other times, it is up to the juror to determine if the offender and the defendant are the same. 6 In future, as the database of images grow and the capability to use computer vision processing accelerates, I can imagine a huge facial image database similar to the DNA database collated in the USA in states like California (LA Times 2012), where instead of DNA samples, CCTV video images from a cold case will be matched to the database in order to track down a suspect. However, unlike DNA, where few people have their DNA recorded in the database, we are moving towards the entire population’s faces being recorded online somewhere, and most likely one day in the hands of law enforcement. What can we learn about the risks of the use of DNA forensic evidence and CCTV evidence to be sure that visual evidence procured through image processing will not create false positives and injustice? Limitations of Visual Evidence in Criminal Prosecution We begin by understanding the limitations of visual evidence for the jurors who must evaluate it in criminal trials. Video is a constructed medium, which can be interpreted in more than one, and even opposing, ways in the court room. After the lawyers for the 4 police officers accused of beating Rodney King deconstructed the eye witness video, 3 of the 4 were acquitted, yet public outcry was so intense that it led to the LA Riots (Gibson 2017). Unlike witnesses, video and images cannot be cross examined, however they are efficiently absorbed by the jury compared to witnesses who may be boring or too technical (Gibson 2017). When evidence is presented by an expert, jurors can suffer from the “white coat effect” which prejudices the juror to weight the experts evidence more heavily (Gibson 2017). Therefore, visual evidence is fraught with a lot of the issues that face forensic evidence more broadly, including DNA evidence. In the USA, since 1994 the FBI have been using the Combined DNA Index System (CODIS): a computer program that enables the comparison of DNA profiles in databases at the local, state, and national level (Morris 2010). Recently, CODIS has been used to search for suspects using DNA matches on cold cases, and a growing proportion of criminal cases are relying on these cold DNA database hits. Worryingly, there have been many examples of a miscarriage of justice, where match statistics were wildly wrong, yet heavily overweighted by the jury despite the accused having no means, motive or opportunity (Murphy 2015). We must explore the limitations of DNA evidence to understand what limitations there could be if image searches were used like this in the future. Like visual evidence, jurors must evaluate DNA evidence in criminal trials. DNA evidence is accompanied by random match probability (RMP) statistics: the likelihood of finding a DNA match by chance. There are many differences between the databases in CODIS: the collection process, accuracy of samples, the criteria for inclusion in the database and the statistical methods and programs used for analysis. (Morris 2010). These differences can lead to very different impacts on match statistics. Research has shown that a juror’s interpretation of the likelihood of a coincidental match also depends on how these statistics are presented (Morris 2010). The statistics are complicated, but 7 seemingly rare events can have surprisingly high likelihood if you present the probability of someone, somewhere matching, rather than the odds of a certain person matching. For example, the chance of any two people in a room having the same birth day and month is greater than 50% if there are more than 22 people in the room. This represents the database match probability. When the Arizona DNA database was searched for intra-database record to record matches they found multiple occurrences of the same DNA profile from different people. The wider the search, the greater the likelihood of a coincidental match, and Type I errors (false positives). Therefore, coincidental matches would be much more likely in a national or even global database of faces. Databases such as CODIS also suffer from ascertainment bias, due to their nonrandom sampling. There are currently 4 different ways of presenting these match statistics (3 of them court approved) with research finding widely different outcomes in terms of verdict (Morris 2010). Jurors fall prey to the prosecutors fallacy “drawing the inappropriate conclusion that a particular probability of chance occurrence is the same as the likelihood that the person incriminated by the statistics is innocent of the crime.” (Morris 2010) How can data scientists prevent their image databases and research from being similarly misunderstood and misrepresented? Recommendations The field of forensic evidence and especially DNA and visual evidence is evolving, and data scientists must conduct themselves today in a way to prevent the pitfalls of injustice now and in the future. Database standardisation is essential in terms of quality of images, compression and formats, plus the data dictionary used. Data Scientists must ensure that their work is statistically sound and agree a common methodology. They must search for opposing evidence, to avoid the trap of confirmation bias. They must form a close relationship with legal professionals to work in forensics. Informed consent must be gained from users to use their images in this way. To protect their privacy and justice, society must become more data literate as these issues are having a greater impact in every part of our lives, even in criminal justice. Bibliography boyd, danah & Crawford, K. 2012, ‘Critical Questions for Big Data’, Information, Communication & Society, vol. 15, no. 5, pp. 662–79. Chintala, S. 2015, The Eyescream Project: NeuralNets dreaming natural images, viewed 14 January 2018, <http://soumith.ch/eyescream/>. Facebook n.d., ‘Facebook Terms of service’, facebook.com, viewed 17 December 2017, <https://www.facebook.com/legal/terms>. Gibson, A.J. 2017, On the face of it: CCTV images, recognition evidence and criminal prosecutions in New South Wales, PhD Thesis. 8 Goodfellow, I.J., Pouget-Abadie, J., Mirza, M., Xu, B., Warde-Farley, D., Ozair, S., Courville, A. & Bengio, Y. 2014, ‘Generative Adversarial Networks’, arXiv:1406.2661 [cs, stat], viewed 14 January 2018, <http://arxiv.org/abs/1406.2661>. Goodman, B. & Flaxman, S. 2016, ‘European Union regulations on algorithmic decision-making and a ‘right to explanation’’, arXiv:1606.08813 [cs, stat], viewed 13 November 2017, <http://arxiv.org/abs/1606.08813>. Henderson, C., Blasi, S.G., Sobhani, F. & Izquierdo, E. 2015, ‘On the impurity of street-scene video footage’, IET Conference Proceedings; Stevenage, The Institution of Engineering & Technology, Stevenage, United Kingdom, Stevenage, viewed 21 January 2018, <https://search.proquest.com/docview/1776480046/abstract/3C556FDE82424A67PQ/7>. Hern, A. 2016, ‘Your battery status is being used to track you online’, The Guardian, 2 August, viewed 30 December 2017, <http://www.theguardian.com/technology/2016/aug/02/batterystatus-indicators-tracking-online>. Koch, G., Zemel, R. & Salakhutdinov, R. 2015, ‘Siamese neural networks for one-shot image recognition’, ICML Deep Learning Workshop. Krizhevsky, A., Sutskever, I. & Hinton, G.E. 2012, ‘Imagenet classification with deep convolutional neural networks’, Advances in neural information processing systems, pp. 1097–1105. LA Times, T.E. 2012, ‘Playing fast and loose with DNA’, Los Angeles Times, 31 July, viewed 13 January 2018, <http://articles.latimes.com/2012/jul/31/opinion/la-ed-dna-database-california- 20120731>. Lipton, Z.C., Berkowitz, J. & Elkan, C. 2015, ‘A Critical Review of Recurrent Neural Networks for Sequence Learning’, arXiv:1506.00019 [cs], viewed 5 November 2017, <http://arxiv.org/abs/1506.00019>. Mordvintsev, A., Olah, C. & Tyka, M. 2015, ‘Inceptionism: Going Deeper into Neural Networks’, Research Blog, viewed 17 December 2017, <https://research.googleblog.com/2015/06/inceptionism-going-deeper-into-neural.html>. Morris, E.K. 2010, Statistical probabilities in a forensic context: How do jurors weigh the likelihood of coincidence?, Ph.D., University of California, Irvine, United States — California, viewed 13 January 2018, <https://search.proquest.com/docview/755686007/abstract/7A00420D28404DF2PQ/2>. Murphy, E.. 2015, Inside the cell: the dark side of forensic DNA, First., Nation Books, New York, NY, USA. New South Wales, Law Reform Commission, New South Wales & Law Reform Commission 2001, Surveillance: an interim report, New South Wales Law Reform Commission, Sydney. OfficerJoeK-9 n.d., ‘Joi’, Off-world: The Blade Runner Wiki, viewed 30 December 2017, <http://bladerunner.wikia.com/wiki/Joi>. Orlowski, A. n.d., ‘Cracking copyright law: How a simian selfie stunt could make a monkey out of Wikipedia’, The Register. 9 Redmon, J., Divvala, S., Girshick, R. & Farhadi, A. 2015, ‘You Only Look Once: Unified, Real-Time Object Detection’, arXiv:1506.02640 [cs], viewed 14 January 2018, <http://arxiv.org/abs/1506.02640>. Sedenberg, E. & Hoffmann, A.L. 2016, ‘Recovering the History of Informed Consent for Data Science and Internet Industry Research Ethics’, arXiv:1609.03266 [cs], viewed 17 December 2017, <http://arxiv.org/abs/1609.03266>. US Copyright Office n.d., Compenduim II of Copyright Office Practices, viewed 17 December 2017, <http://www.copyrightcompendium.com/>. Varior, R.R., Haloi, M. & Wang, G. 2016, ‘Gated Siamese Convolutional Neural Network Architecture for Human Re-Identification’, arXiv:1607.08378 [cs], viewed 13 January 2018, <http://arxiv.org/abs/1607.08378>. Wikipedia 2018, ‘Edward Snowden’, Wikipedia, viewed 13 January 2018, <https://en.wikipedia.org/w/index.php?title=Edward_Snowden&oldid=819863748>. Wikipedia 2017, ‘Personality rights’, Wikipedia, viewed 30 December 2017, <https://en.wikipedia.org/w/index.php?title=Personality_rights&oldid=814604845>.
The fast fashion industry, which includes brands
such as H&M, Zara, Forever21, Asos and TopShop, serves up new products at
historically low prices and at an ever growing pace: within weeks of New York Fashion
Week or being worn by the latest It girl (Kindred, 2015). Using data driven marketing, rapid product
development and agile supply chain management, annual product lines have
increased tenfold, product life cycles have decreased from months to weeks and
even days (Sull and Turconi, 2008) and customers can consume clothing in on
demand, disposable manner (Pal 2016).
As it feeds insatiable consumer demand, fast
fashion is considered by some to epitomise materialistic consumption (Kim et al
2013). The rapid growth comes at social and environmental cost: unethical labour
practices with poor health and safety such as child labour, sweatshops, excessive
waste from disused clothing, and production methods that pollute the land,
water and air (Kim et al 2013).
This represents a new opportunity for the
sustainable fashion industry, as anti-consumerism is turning some consumers
away from fast fashion (Kim et al 2013). The industry, dubbed “slow fashion” akin
to the slow food movement, flies in the face of the fast fashion trend, as it pursues
the “triple bottom line” objectives of economic prosperity, social justice and environmental
quality (Elkington 1994).
This paper will explore how slow fashion
can follow the lessons of fast fashion to transform itself using data in order
to achieve their sustainability objectives.
This paper will discuss how, in order to
achieve their objectives, the Slow Fashion industry must overcome 3 key
challenges: (1) increase customer lifetime value, (2) reduce waste, and (3) prove
a sustainable supply chain.
The business model of Slow Fashion, is characterised
by higher unit costs and lower sales volumes. Handmade, artisanal items take
time and skill to create, so they cost more per item, but tend to promote more
timeless and more durable and therefore last longer (Clark, 2008).
As a result, Slow Fashion must find
innovative ways to engage consumers over a long period of time to increase
customer lifetime value (CLV), such as gathering and synthesizing data about
what customers want (Zarley Watson and Yan 2013).
Customer Segmentation
Slow Fashion can mimic its nemesis the fast
fashion industry and obtain consumer demand data throughout the sales cycle as
shown in Figure 1 (Kindred 2015). This enables a better knowledge of customers
and supports agile product development (Sull and Turconi, 2008).
Consumer demand data is obtained through surveys,
quizzes, competitions, social media mining, A/B testing of campaigns, using
cookie tracking, wish lists, browsing behaviour, shopping cart and purchasing
history, and participation in loyalty programmes (Kindred 2015).
Once the data is gathered, unstructured
machine learning algorithms such as “K-Means Clustering” (Hartigan and Wong
1979) is used to make meaningful consumer segments to identify and target the
styles and preferences of existing (and new) consumers. These segments, combined with identity
management API services are used to recognise and know customers across devices
(mobile, desktop, in store), tailor marketing campaigns, help them discover new
product ranges, and make recommendations to suit their style and stage of the
customer life cycle (Kindred 2015). This is turn drives customer loyalty and
hence CLV.
Product Discovery and Recommendations
Recommendations algorithms are being built for
product discovery, which, when accurate, encourages more frequent purchases
from a customer increasing their Total Average Revenue Per User (ARPU) and
total average products per user (APPU). These can be suggested to consumers
when online, via eDM, or returned as search results, and may utilise natural
language processing and visual search (although these are both nascent
technologies) (Kindred 2015).
By building artificial intelligence based
learning mechanisms (such as a feedback loop on click through rates among other
indicators), the accuracy of recommendations algorithms can improve, in turn
driving better customer retention and repeat visits (in store and online) in a
cost efficient way.
Figure 1 Fashion
Data Cycle (Kindred 2015)
However, categorising and classifying customer
preferences and inventory into a metadata taxonomy and structure to enable
natural language processing and visual search can be challenging. There is no
universal taxonomy for fashion styles, colours and preferences, from a product
or a customer point of view (Kindred 2015). For example, the slightest change
in hue of colour or the length of an item can make all the difference in what
is “on trend”. In addition, the visual images of collections and related
metadata are intellectual property and brands are unwilling to release this
information, which limits the data available for these services (Kindred 2015).
For an organisation to become more data
intensive, a significant change in mind set and skill set is required (in order
to change company’s culture towards data driven decisions. The data science
skills required to achieve this customer segmentation are short in supply and
might not be as accessible to small
manufacturers, which Slow Fashion entrepreneurs usually are.
By delivering the right product, in the
right quantity to the right location to the right customer, the fashion
industry has an opportunity to reduce waste (Sull and Turconi 2008). This is
even more crucial for the Slow Fashion industry, as the lead times are
naturally longer due to sustainable production practices, the supply chain is
less agile and conservation of natural resources is also an objective. Utilising
data to improve sales forecasts and optimise systems can reduce waste for slow
fashion brands.
Accurate Sales Forecasts
Sales forecasts must be accurate at an
individual SKU level in order to avoid stock outs and discounting, however this
is a challenge as demand is highly uncertain and seasonal (Guo et al, 2011).
Through the data gathered on consumer
preferences throughout the product data cycle (Figure 1), and through tracking
market signals i.e. key word mentions in media, influencers and brands online
channels, and visual image search and recognition, Slow Fashion can build more
accurate demand forecasts as fast fashion players. Statistical techniques and
machine learning presents an opportunity to take hundreds of signals in real
time and translate them into a product forecast (Guo et al, 2011).
However, analysing and making sense of this
data cannot be performed by machines alone as fashion is characterised by
subjectivity, extreme fluctuations in demand and contextual relevance (Kindred
2015). For example, the hands-on role of Zara’s store managers has been
critical to the success of Zara’s agile supply chain (Sull and Turconi 2008).
Human understanding is needed to interpret
the qualitative and quantitative data, in order to differentiate in real time, between
an anomaly and an emerging trend, and adjust forecasts as necessary (Kindred
2015).
Optimisation of Systems
Optimising production processes and the distribution
value chain is also crucial for ensuring efficient use of resources and
reducing waste.
In recent years, the price of
microprocessors and cloud storage is becoming so low that it is possible to
connect almost all devices to the internet, for example putting a micro-chip into
each garment like UnderArmor – Fitbit for clothes (Kindred 2015). Through this
“Internet Of Things”, performance data for key elements of Slow Fashion
production, distribution network, online and offline, can be tracked in real
time and stored in the cloud.
Data analytics and structured machine
learning algorithms can be used to analyse and visualise this data, in order to
provide solutions that optimise processes and production to reduce waste and
use resources sustainably i.e. factor in enough workers so hours are
reasonable, allow enough time for fields to recover between plantings etc (Guo
et al 2011).
The challenge with obtaining this data is
the internet connectivity and power supply of local suppliers who are often in
developing nations may not be reliable, and therefore there may be missing
data. In addition, despite the reduction in tracking costs, rolling out a
tracking system to a large number of small independent producers may not be
feasible for the smaller scale slow fashion brand.
Slow Fashion has the desire to prove to stakeholders
that their supply chain is managed sustainably, and the provision of reporting
can provide transparency and traceability to illustrate this (Morgan 2015).
By tracking raw materials from their source
(using the Internet Of Things as described above), reporting on key equity
measures such as working hours, and the production of, and payments to
artisanal suppliers, and the use of data visualisations on Slow Fashion brands
websites, consumers can see the origin of their purchases, and also see the
impact their patronage is having on local communities over time (Carter and
Rogers 2008).
In addition, in order to make the Slow
Fashion supply chain as agile and responsive as possible, it can use supplier
identity credentials, electronic data interchange and open book accounting to enable
trust between suppliers, brands and consumers (Park et al 2013).
However, slow fashion brands are not
generally of the scale to demand compliance from their suppliers, and gathering
consent might be difficult. Suppliers may be primary producers without IT
systems, so obtaining consistent, accurate and regular data could be a
challenge.
Lastly, this kind of open data sharing
could be a privacy issue for many small suppliers as it basically reveals their
household income. In areas of civil unrest, data could be used for unintended
purposes and compromise the safety of some suppliers.
This paper has shown how Slow Fashion participants
can become more data driven to address the opportunities and challenges facing
their industry.
They can use data mining to identify
potential customers as consumers pursue fast fashion avoidance. Concurrently,
they can use product and consumer data to know their customers better, and
through algorithms and machine learning, match their product line and processes
with consumer demand more accurately increasing ARPU and APPU. These strategies
reduce waste, grow revenue and improve the triple bottom line (Elkington 1994).
Furthermore, using data to report on the
supply chain can also prove to stakeholders that a Slow Fashion brand is
authentic and sharing value with its suppliers, and over time illustrate that
it is delivering long term value to the communities that work with it.
This data intensity will require a
significant mind shift amongst suppliers and brands in order to make data
central to decision making, as well as making the supply chain mobile internet
connected.
In this way, as Slow Fashion becomes more
data intensive, they can innovate in a way to achieve the triple bottom line
benefits of economic prosperity, social justice and environmental quality.
Carter, C.R., and Rogers D.S (2008) “A framework of sustainable
supply chain management: moving toward new theory” International Journal of
Physical Distribution & Logistics Management Vol. 38 (5): 360-387
Clark, H., 2008. SLOW + FASHION – an oxymoron-or a promise for the
future…?. Fashion Theory,12(4): 427-446.
Guo, Z.X, Wong, W.K, Leung,
S.Y.S and Li, Min (2011) “Applications
of artificial intelligence in the apparel industry: a review” Textile Research Journal 81(18):1871–1892
Hartigan, J. A.; Wong, M. A.
(1979). “Algorithm AS 136: A K-Means Clustering Algorithm”. Journal
of the Royal Statistical Society, Series C. 28 (1):
100–108
Kindred, L.and Steele, J. (2015) “Fashioning Data: A 2015 Update”
O’Reilly Media Inc, Sebastopol
Kim, H., Ho, J.C, Yoon, N. (2013) “The motivational drivers of fast fashion avoidance” Journal of Fashion Marketing
and Management `7(2): 243-260
Jung, S., and Jin, B., (2016)
“Sustainable Development of Slow Fashion Businesses: Customer Value Approach”
Sustainability 8(6) :540-556
Morgan, T. R. (2015) “Supply chain
transparency: An overlooked critical element of supply chain management” The
University of Alabama, Tuscaloosa
Pal, R. 2016. “Sustainable
Value Generation Through Post-retail Initiatives: An Exploratory Study of Slow
and Fast Fashion Businesses.” In Green Fashion, edited by S. S. Muthu and
M. A. Gardetti
Park, A., Nayyar, G., and Low, P.
(2013) “Supply Chain perspectives and issues: A literature review” World Trade
Organisation and Fung Global Institute, Geneva
Sull, D., Turconi, S. (2008) “Fast
Fashion Lessons” Business Strategy Review19.2 (Summer 2008): 4-11.
Zarley Watson M, and Yan, R.
(2013)” An exploratory study of the decision processes of fast versus slow
fashion consumers” Journal of Fashion
Marketing and Management 17(2): 141-159
A report written as part of my Masters of Communication Data Science at University of Southern California in Fall 2018.
Abstract
Racial disparities in health care outcomes contribute to African Americans (AA) men living ten years less on average than a white American (Rosenberg, Ranapurwala, Townes, & Bengtson, 2017). One of those disparities is due to prostate cancer (PC), the second most deadly form of cancer in America, with a mortality rate double the rate for AA men than non-Hispanic whites (American Cancer Society, 2018). This literature review examines the research for possibilities to reduce this racial disparity to zero, by asking what are the underlying factors that cause these outcomes for AA men? This question will be answered by considering the attitudes, beliefs and behaviors of both patients and health care providers and focusing on where there are racial differences.
Eradicating Racial Differences in
Prostate Cancer Outcomes
Literature Review
Racial disparities in health care outcomes contribute to
African Americans (AA) men living ten years less on average than a white
American (Rosenberg et al., 2017). One of those disparities is due to prostate
cancer (PC), the second most deadly form of cancer in America, with a mortality
rate double the rate for AA men than non-Hispanic whites (American Cancer Society, 2018). This literature review examines the research for
possibilities to reduce this racial disparity to zero.
Prostate Cancer in America
In 2018, 29,000 American men are predicted to die due to PC,
and160,000 new cases will be diagnosed (American Cancer Society, 2018)1.
The longer a man lives, the higher the likelihood he will
have PC, yet most men “die with prostate cancer, not die from it” (Ablin, 2014; Peehl, 1999).
This is because the unique, dual nature of PC: one type is microscopic,
almost latent and very slow growing, and the other is much more aggressive,
metastic and deadly (Ablin, 2014; Peehl, 1999; Schröder,
Hugosson, Roobol, & et al, n.d.) 2. Therefore, despite PC being so fatal, the
numbers are relatively low considering how many will men have it (Peehl, 1999).
Incidents and deaths from PC skyrocketed in the nineties (National Cancer Institute, 2017). At this time, a general male
population test was introduced; the prostate specific antigen (PSA) test, but its
use quickly became controversial (Ablin, 2014).
It is not cancer-specific, and as there is a high incidence
of pre-malignant microscopic lesions in most prostate glands, critics argue the
test overdiagnoses the severity of the cancer, resulting in unnecessary
biopsies and radical treatment, rather than watching and waiting to determine
what kind of tumor it is 3 (Ablin, 2014; Andriole et al., 2009; Benoit & Naslund, 1995; Halpern
et al., 2017; Lyons et al., 2017; Moyer, 2012; Peehl, 1999; Schröder et al.,
n.d.; Vollmer, 2012).
In fact, in 2012 the U.S Preventive Services Task Force (USPSTF)
recommended against the use of PSA for general population screening, but rather
recommended it for use in Active Surveillance to determine the rate of growth
of the cancer (Andriole et al., 2009; Moyer, 2012).
The changing levels of use of the PSA test before and after
the USPSTF recommendation has directly and significantly impacted the biopsy
and radical prostatectomy volumes (Ablin, 2014; Halpern et al., 2017).
This conflict between health care practice and the advice of
government bodies makes a challenging environment for the prevention and treatment
of PC.
Prevalence of Prostate Cancer in African American men
Disturbingly, African Americans (AA) have for many years had
the highest rates of PC caused fatalities in the world (Blocker, Romocki, Thomas, Jones, &
al, 2006; Levi, Kohler, Grimley, & Anderson-Lewis, 2007; Odedina, Scrivens,
Emanuel, LaRose-Pierre, & al, 2004).
In 2017, prostate cancer incidence rates for African
Americans (AA) were 1.5 times more likely than for non-Hispanic white
Americans (NHWs), and mortality rates
were double that of NHWs (National Cancer Institute, 2017;
Taksler, Cutler, Giovannucci, Smith, & Keating, 2013; Taksler, Keating,
& Cutler, 2012).
The AA mortality rate has dropped by over 30% since 2007, and
over 400% since 1993, when the disparity was 2.5 times greater likelihood to
die from prostate cancer than NPW, however this is still a very poor outcome for
a lot of Americans (National Cancer Institute, 2017;
Taksler et al., 2012).
The direct drivers of this disparity are threefold: AA
develop PC earlier in life, and the cancer is at a later stage when diagnosed,
and once diagnosed AA do not receive all the recommended treatments (American Cancer Society, 2018; Hawley
& Morris, 2017; Levi et al., 2007; Morris, Rhoads, Stain, & Birkmeyer,
2010; National Cancer Institute, 2017).
This literature review asks: what are the underlying factors
that cause these outcomes for AA men?
From a biological point of view, there is no strong evidence
to date to prove that AA experience more aggressive tumor biology than NDWs (Jaratlerdsiri et al., 2018; Morris et
al., 2010).
African genes may be more susceptible to PC in general however, (Chornokur et al., 2012; Wang et al.,
2017),
and recent genome sequencing research
has indicated the potential for a genetic difference resulting in worse health
outcomes for those with African genes (Jaratlerdsiri et al., 2018).
Physically, the reduced ability to absorb vitamin D may be
contributing to racial disparities. Vitamin D deficiency has been linked to
prostate cancer, and AAs with higher melanin in their skin are slower to absorb
Vitamin D than white people (Peehl, 1999; Taksler et al., 2012). Further research in the
biology of PC in AA would be worthwhile.
Lower socioeconomic status (SES) is a factor in lower PC
survival rates (Klein & von dem Knesebeck, 2015), and as a large proportion of
AA are in lower SES groups than NHWs, they suffer PC disproportionately due to
SES also (Morris et al., 2010).
The rest of this literature review focuses on whether there
are racial disparities in patient and practitioner behavior that may contribute
to AA to not be diagnosed early enough and to not receive all the recommended
treatment (Morris et al., 2010).
Exploration of casual factors in racial disparity using Reasoned Action
Approach
The reasoned-action approach can be used
as a framework to predict a person’s behavior towards prevention, screening and
treatment of PC (Ajzen, 1991; McEachan et al., 2016;
Tippey, 2012).
“The
reasoned-action approach states that attitudes towards the behavior,
perceived norms, and perceived behavioral control determine people’s
intentions, while people’s intentions predict their behaviors.” (Levi et al., 2007).
Patient Attitudes, Beliefs and Perceptions
Patients behaviors regarding prevention, screening and
treatment options have many influences, some have been proven to contribute to
racial disparities in PC outcomes, and others have not.
Participation in prevention and screening behavior
In terms of preventative health attitudes and behaviors,
research has found that a diet high in red meat and fat increases the risk of
prostate cancer, and conversely a diet high in vegetables (especially
cruciferous vegetables) has been shown to reduce it (Blocker et al., 2006; Cohen, Kristal,
& Stanford, 2000). The AA
diet is generally worse on these measures than white men (Blocker et al., 2006). Attitudes underlying this
difference could be a significant contributor to the racial disparity in
mortality rate and would be good to research further.
AA have lower participation rates in PC screening that NHW (Morris et al., 2010), which definitely contributes
to the higher mortality rate. There are different reasons for this.
Research has found that those with family history have
greater knowledge of the risk of PC as representativeness and availability
heuristics works towards weighting the risk appropriately (McDowell, Occhipinti, & Chambers,
2013).
There is no evidence that this is a cause of racial disparity however.
However, there is a body of research supporting significant
negative associations to screening behavior in AA men, relating to feelings of
embarrassment, decision regret for multiple types of treatment and threats to
masculine sexual identity as a result of impotence and lethargy following
treatment, but again it is not known if these contribute to the racial
disparity (Allen, Kennedy, Wilson-Glover, &
Gilligan, 2007; Collingwood et al., 2014; Hawley & Morris, 2017; Odedina et
al., 2004).
Studies have shown that awareness or knowledge of screening
was less of an indicator of participating in screening than being advised to do
so by a doctor (Meissner, Potosky, & Convissor,
1992).
Evidence supports that there is a racial discrepancy in having a regular
doctor, and trust in the health care profession, due to a history and
perceptions of racism, and also cognitive biases and difficulty in
communication because so many of the medical profession are white and have
different cultural sensitivities (Blocker et al., 2006; Hawley &
Morris, 2017; Kahneman & Frederick, 2002; Morris et al., 2010; Odedina et
al., 2004).
Building up trust and regular contact with the medical
profession is vital for AA to receive culturally and personally relevant
advice, to encourage participation in screening despite the negative
associations and attitudes towards prostate cancer (Grubbs et al., 2013; Hawley &
Morris, 2017; Morris et al., 2010). A program in Delaware brought the racial
disparity in colorectal cancer down to zero over ten years, through building up
trust by using local doctors and community leaders to promote screening
behaviors (Grubbs et al., 2013).
Attitudes and preferences in regards treatment
Attitudes and preferences towards treatment options have
been measured in studies in terms of expectations, decision conflict,
satisfaction and regret, and mostly there were no racial disparities, except
for one very important one (Collingwood et al., 2014; Lyons et
al., 2017; Meissner et al., 1992; Potosky et al., 2001; Reamer, Yang, & Xu,
2016).
The main racial disparity lies in the lower proportion of AA
men who participate in a shared decision-making process with their doctor,
which in turn affects the metrics (Collingwood et al., 2014; Hawley &
Morris, 2017; Morris et al., 2010).
One study found that decision regret was greater in African
Americans, for both radical surgery and non-treatment, and it was suggested
that this could be due to the level of shared decision making with the health
care provider to manage patient expectations (Collingwood et al., 2014).
Higher decision regret due to reduced quality of life from
radical surgery can reinforce the community’s negative associations with
prostate cancer, and influence the number of people participating in screening (Blocker et al., 2006; Hawley &
Morris, 2017)
In addition, if the treatment is biased towards active
treatment over active surveillance, these impacts can also be totally avoidable
because the surgery may be unnecessary, and therefore these outcomes reinforce
the feeling of mistrust (Ablin, 2014; Reamer et al., 2016; Xu
et al., 2016).
Studies have shown there does tend to be a bias towards
active treatment over active surveillance, however no racial differences were
found in the results (Reamer et al., 2016; Xu et al., 2016). Patients are fearful upon
being diagnosed with PC, and feel that active surveillance is “doing nothing” (Reamer et al., 2016; Xu et al., 2016). Hence doctors play a vital
role in ensuring patients control their fear and make a good decision for their
treatment (Blocker et al., 2006; Reamer et al.,
2016; Xu et al., 2016).
Lyons et al also looked at preferences for active treatment (AT)
versus active surveillance, and found that people with a close relationship
with a trusted physician were able to overcome their preference for AT (Lyons et al., 2017). Again, no racial disparity
was found, but this must be considered in the context of lesser participation
of regular contact with a regular doctor in AA communities (Grubbs et al., 2013; Hawley &
Morris, 2017; Morris et al., 2010).
Health Care Providers Knowledge and Beliefs
The literature reveals three potential factors for
unbalanced representation of AA in PC health care.
Researchers
Researchers may be employing heuristics that unintentionally
create systematic bias that excludes AA in their research, or focus overly on
them as controlling the outcome (Kahneman & Frederick, 2002).
For example, Vastola et al argue that the criteria for
participation in clinical trials are set at levels that exclude a
disproportionate number of AA, due to differences in the average levels for
these criteria between NHW and AA populations (Vastola et al., 2018).
Whilst there has not been a review of research disparities
in PC, research conducted by Rosenberg et al found that homicide was the
biggest contributor to mortality for AA and received significantly less
research funding and effort than heart disease which was the greatest killer of
white people (Rosenberg et al., 2017).
Therefore, researchers need to consider if their programs
are unintentionally excluding African Americans.
Health Care Providers
Health care providers are essential to giving AA patients
sound advice when choosing active treatment over active surveillance, given the
consequences to the patients quality of life (Ablin, 2014; Collingwood et al., 2014;
Lyons et al., 2017).
Patients are biased towards action due to the fear of being diagnosed with PC,
and feel that active surveillance is doing nothing (Ablin, 2014; Collingwood et al., 2014;
Lyons et al., 2017).
It is up to the doctor to advise them that most PC is not aggressive and should
be monitored in the first instance, because once they are referred to a
urologist, the chance of them having surgery increases dramatically (Ablin, 2014; Collingwood et al., 2014;
Lyons et al., 2017).
Administrators and Government
There is a very sound business case for government
investment in free screening and treatment of PC for lower SES African
Americans.
A ten-year trial in Delaware for colorectal cancer reduced
the racial disparity in mortality to zero by providing free screening and
treatment to low SES people, and it was much cheaper than funding surgery and
medicines (Grubbs et al., 2013). This program was also culturally
sensitive, utilizing local doctors and community leaders like pastors to
promote screening (Grubbs et al., 2013).
Government and policy makers must consider if they are
biased towards cures rather than prevention, or are allocating resources
towards one community over another and contributing to the PC mortality rate
disparity.
Further areas for research
Overall, it is difficult to grasp which factors are the
more significant contributors to racial disparity in PC mortality from the
research, because each study is on such a narrow topic.
Therefore, further research to measure the impact of each
factor would be useful to be able to prioritize efforts to reduce the AA
mortality rate.
An analysis of the research from this perspective, plus
quantitative analysis to build a predictive model would be useful.
Also, researchers should try to cover the views of
patients and practitioners in their studies, as that relationship is so
important in the prevention of PC deaths.
Lastly, research into the reasoned action approach in
relation to a PC preventative diet would also be fruitful.
References
Ablin, R. J. (2014). The great
prostate hoax : how big medicine hijacked the PSA test and caused a public
health disaster (First edition.). New York, NY: Palgrave Macmillan.
Allen, J. D., Kennedy, M., Wilson-Glover, A., &
Gilligan, T. D. (2007). African-American
men’s perceptions about prostate cancer: Implications for designing educational
interventions. Social Science & Medicine, 64(11), 2189–2200.
https://doi.org/10.1016/j.socscimed.2007.01.007
Andriole,
G. L., Crawford, E. D., Grubb, R. L., Buys, S. S., Chia, D., Church, T. R., …
PLCO Project Team. (2009). Mortality results from a randomized prostate-cancer
screening trial. The New England Journal of Medicine, 360(13),
1310–1319. https://doi.org/10.1056/NEJMoa0810696
Benoit,
R. M., & Naslund, M. J. (1995). Detection of latent prostate cancer from
routine screening: comparison with breast cancer screening. Urology, 46(4),
533–536; discussion 536-7.
Blocker,
D. E., Romocki, L. S., Thomas, K. B., Jones, B. L., & al, et. (2006). Knowledge, Beliefs and Barriers
Associated with Prostate Cancer Prevention and Screening Behaviors among
African-American Men. Journal of the National Medical Association;
Washington, 98(8), 1286–1295.
Chornokur,
G., Han, G., Tanner, R., Lin, H., Gwede, C., Kumar, N., … Phelan, C. (2012).
Risk factors of prostate cancer in African American men. Cancer Research,
72(s8). https://doi.org/10.1158/1538-7445.AM2012-3592
Cohen,
J. H., Kristal, A. R., & Stanford, J. L. (2000). Fruit and Vegetable
Intakes and Prostate Cancer Risk. Journal of the National Cancer Institute,
92(1), 61–68. https://doi.org/10.1093/jnci/92.1.61
Collingwood,
S. A., McBride, R. B., Leapman, M., Hobbs, A. R., Kwon, Y. S., Stensland, K.
D., … Samadi, D. B. (2014). Decisional regret after robotic-assisted
laparoscopic prostatectomy is higher in African American men. Urologic
Oncology: Seminars and Original Investigations, 32(4), 419–425.
https://doi.org/10.1016/j.urolonc.2013.10.011
Grubbs,
S. S., Polite, B. N., Carney, J., Bowser, W., Rogers, J., Katurakes, N., …
Paskett, E. D. (2013). Eliminating Racial Disparities in Colorectal Cancer in
the Real World: It Took a Village. Journal of Clinical Oncology, 31(16),
1928–1930. https://doi.org/10.1200/JCO.2012.47.8412
Halpern,
J. A., Shoag, J. E., Artis, A. S., Ballman, K. V., Sedrakyan, A., Hershman, D.
L., … Hu, J. C. (2017). National Trends in Prostate Biopsy and Radical
Prostatectomy Volumes Following the US Preventive Services Task Force
Guidelines Against Prostate-Specific Antigen Screening. JAMA Surgery, 152(2),
192–198. https://doi.org/10.1001/jamasurg.2016.3987
Hawley,
S. T., & Morris, A. M. (2017). Cultural Challenges to Engaging Patients in
Shared Decision Making. Patient Education and Counseling, 100(1),
18–24. https://doi.org/10.1016/j.pec.2016.07.008
Jaratlerdsiri,
W., Chan, E. K. F., Gong, T., Petersen, D. C., Kalsbeek, A. M. F., Venter, P.
A., … Hayes, V. M. (2018). Whole Genome Sequencing Reveals Elevated Tumor
Mutational Burden and Initiating Driver Mutations in African Men with
Treatment-Naive, High-Risk Prostate Cancer. Cancer Research,
canres.0254.2018. https://doi.org/10.1158/0008-5472.CAN-18-0254
Kahneman,
D., & Frederick, S. (2002). Representativeness revisited: Attribute
substitution in intuitive judgment. In Heuristics and biases: The psychology of intuitive judgment.
(pp. 49–81). New York, NY, US: Cambridge University Press.
https://doi.org/10.1017/CBO9780511808098.004
Klein, J., & von dem Knesebeck, O. (2015). Socioeconomic inequalities in prostate
cancer survival: A review of the evidence and explanatory factors. Social
Science & Medicine, 142, 9–18.
https://doi.org/10.1016/j.socscimed.2015.07.006
Levi,
R., Kohler, C. L., Grimley, D. M., & Anderson-Lewis, C. (2007). The Theory
of Reasoned Action and Intention to Seek Cancer Information. American Journal
of Health Behavior; Star City, 31(2), 123–134.
Lyons,
K. D., Li, H. H., Mader, E. M., Stewart, T. M., Morley, C. P., Formica, M. K.,
… Hegel, M. T. (2017). Cognitive and Affective Representations of Active
Surveillance as a Treatment Option for Low-Risk Prostate Cancer. American
Journal of Men’s Health, 11(1), 63–72.
https://doi.org/10.1177/1557988316657041
McDowell,
M. E., Occhipinti, S., & Chambers, S. K. (2013). The influence of family
history on cognitive heuristics, risk perceptions, and prostate cancer
screening behavior. Health Psychology, 32(11), 1158–1169.
http://dx.doi.org.libproxy2.usc.edu/10.1037/a0031622
McEachan,
R., Taylor, N., Harrison, R., Lawton, R., Gardner, P., & Conner, M. (2016).
Meta-Analysis of the Reasoned Action Approach (RAA) to Understanding Health
Behaviors. Annals of Behavioral Medicine, 50(4), 592–612.
https://doi.org/10.1007/s12160-016-9798-4
Meissner,
H. I., Potosky, A. L., & Convissor, R. (1992). How Sources of Health
Information Relate to Knowledge and Use of Cancer Screening Exams. Journal
of Community Health; New York, N.Y., 17(3), 153–165.
Morris,
A. M., Rhoads, K. F., Stain, S. C., & Birkmeyer, J. D. (2010).
Understanding Racial Disparities in Cancer Treatment and Outcomes. Journal
of the American College of Surgeons, 211(1), 105–113.
https://doi.org/10.1016/j.jamcollsurg.2010.02.051
National
Cancer Institute. (2017, April 14). SEER*Explorer: An interactive website for
SEER cancer statistics. Retrieved September 28, 2018, from
https://seer.cancer.gov/explorer/.
Odedina,
F. T., Scrivens, J., Emanuel, A., LaRose-Pierre, M., & al, et. (2004). A Focus Group Study of Factors
Influencing African-American Men’s Prostate Cancer Screening Behavior. Journal
of the National Medical Association; Washington, 96(6), 780–788.
Potosky, A. L., Knopf, K., Clegg, L. X., Albertsen, P.
C., Stanford, J. L., Hamilton, A. S., … Hoffman, R. M. (2001). Quality-of-Life Outcomes After Primary
Androgen Deprivation Therapy: Results From the Prostate Cancer Outcomes Study. Journal
of Clinical Oncology, 19(17), 3750–3757.
https://doi.org/10.1200/JCO.2001.19.17.3750
Reamer,
E., Yang, F., & Xu, J. (2016). Abstract A48: Treatment decision making in a
population-based sample of black and white men with localized prostate cancer. Cancer
Epidemiology and Prevention Biomarkers, 25(3 Supplement), A48–A48.
https://doi.org/10.1158/1538-7755.DISP15-A48
Rosenberg,
M., Ranapurwala, S. I., Townes, A., & Bengtson, A. M. (2017). Do black
lives matter in public health research and training? PLoS ONE, 12(10).
https://doi.org/10.1371/journal.pone.0185957
Segal,
R. J., Reid, R. D., Courneya, K. S., Malone, S. C., Parliament, M. B., Scott,
C. G., … Wells, G. A. (2003). Resistance Exercise in Men Receiving Androgen
Deprivation Therapy for Prostate Cancer. Journal of Clinical Oncology, 21(9),
1653–1659. https://doi.org/10.1200/JCO.2003.09.534
Taksler,
G. B., Cutler, D. M., Giovannucci, E., Smith, M. R., & Keating, N. L.
(2013). Ultraviolet index and racial differences in prostate cancer incidence
and mortality. Cancer, 119(17), 3195–3203.
https://doi.org/10.1002/cncr.28127
Taksler,
G. B., Keating, N. L., & Cutler, D. M. (2012). Explaining racial
differences in prostate cancer mortality. Cancer, 118(17),
4280–4289. https://doi.org/10.1002/cncr.27379
Vastola,
M. E., Yang, D. D., Muralidhar, V., Mahal, B. A., Lathan, C. S., McGregor, B.
A., & Nguyen, P. L. (2018). Laboratory Eligibility Criteria as Potential
Barriers to Participation by Black Men in Prostate Cancer Clinical Trials. JAMA
Oncology, 4(3), 413–414. https://doi.org/10.1001/jamaoncol.2017.4658
Vollmer,
R. T. (2012). The Dynamics of Death in Prostate Cancer. American Journal of
Clinical Pathology, 137(6), 957–962.
https://doi.org/10.1309/AJCPJK9V9LUMUETV
Wang,
Y., Freedman, J. A., Liu, H., Moorman, P. G., Hyslop, T., George, D. J., … Wei,
Q. (2017). Associations between RNA splicing regulatory variants of
stemness-related genes and racial disparities in susceptibility to prostate
cancer: Stemness-related genes and racial disparities in prostate cancer. International
Journal of Cancer, 141(4), 731–743. https://doi.org/10.1002/ijc.30787
Xu,
J., Janisse, J., Ruterbusch, J. J., Ager, J., Liu, J., Holmes-Rovner, M., &
Schwartz, K. L. (2016). Patients’ Survival Expectations With and Without Their
Chosen Treatment for Prostate Cancer. The Annals of Family Medicine, 14(3),
208–214. https://doi.org/10.1370/afm.1926
Footnotes
1 For the record, lung cancer is the greatest killer for both men and women, with over 150,000 deaths estimated for 2018 (American Cancer Society, 2018).
2
“Independent, multiple foci of cancer are present in the majority of prostate
specimens, and the incidence of premalignant lesions is even higher than that
of cancer. Yet, despite the high incidence of microscopic cancer, only 8% of
men in the US present with clinically significant disease during their
lifetime. Furthermore, only 3% of men in the US die of prostate cancer. In no
other human cancer is there such disparity between the high incidence of
microscopic malignancy and the relatively low death rate. Thus, there are many
windows of opportunity for control of prostate cancer.” (Peehl,
1999)
3 There are a number of different treatment
options for PC: open retropubic radical prostatectomy, the newer robot assisted
laparoscopic prostatectomy, external beam radiation, primary androgen
deprivation therapy (to castration levels) and active monitoring/surveillance (Collingwood et al., 2014; Potosky et
al., 2001; Segal et al., 2003).
Figure 1 Conceptual Model
Figure 1. A conceptual model of mechanisms underlying disparities in cancer outcomes (Morris et al., 2010)
As shown in Figure 1 above, cancer outcomes are influenced
by effective cancer care, which in turn is driven by the patient’s utilization
of health care, and quality of health care provided by the system and
practitioners (Morris et al., 2010).
Utilization of health care can be influenced by the patients
socioeconomic status (SES) which affects their knowledge and ability to pay for
care, geography which affects their access to care, race as physical
differences can make a person more susceptible to certain cancers, and the
persons beliefs and preferences (Morris et al., 2010). There
are also physical differences such as cancer stage, tumor biology, and comorbid
diseases.
The quality of health care is influenced by the practioners
knowledge, beliefs and technical skills, and the resources of the health care
system (Morris et al., 2010).
Welcome! I am Tracy Keys, and you can find me on Instagram @benjibex.
This blog is all about my passion for media, entertainment, fashion, society and the environment and how data science can be used as a tool in communication, activism, politics and marketing. This site is a showcase for my creations as I develop from data lover to communication data science professional.
I’m just getting this new blog going, so right now it’s mostly the transfer of my academic papers and blogs into one place. Ultimately, I want to express myself with data science and explore society through this medium: data science is also an art and highly creative as well as being analytical. The work to date comes from my journey of exploration and learning, but bringing it to life with my tone of voice will no doubt be a lifelong addiction. Stay tuned for more blog entries. Subscribe below to get notified when I post new updates.
I have recently discovered that turnover is defined by cash plus wagering wins, which means if a person puts in $300 cash, wins and loses $2700 over the course of the day in small increments, and then loses their $300 too, they have “wagered” $3000 and “won” $2700 so the expenditure is only $300 ie 10% gross margin. So I cant even begin to count how much has really been lost or wagered by problem gamblers! This makes true measurement/ accurate metrics so much more important.
You may have heard that NSW has the second highest number of gaming machines in the world (99k), second only to Nevada (181k). But unlike Nevada, whose capitol is Las Vegas, these poker machines are all in local pubs and clubs, being played by regular locals, not tourists. (The 200k gaming machines in Australia does not include those in Casinos.) So what does this mean for local people and our communities in NSW and around Australia?
The Queensland Government have been conducting a survey “Australian Gambling Statistics” nationally for 33 years.
33 years ago, in 1990/91, Gaming Machine gross profit (known as expenditure in the survey) was $3.2bn in today’s dollars, or $233 lost on average per Australian adult . As shown in Figure 1, the biggest losers were NSW ($680.50) and the ACT ($649.10).
Figure 1 Real Gaming Machine Expenditure per capita 1990/1991
Gaming machines were first made legal in Australia in 1956, but these days Australians play electronic gaming machines (EGMs) with much faster spin cycles and multi line play that can accept notes, without limit. This means that a person can now put as much as $1500 an hour through a gaming machine (Productivity Commission). Figure 2 compares the old mechanical “one armed bandits” with the modern EGM.
Figure 2 An original Aristocrat gaming machine compared to a modern Electronic Gaming Machine
Now, in 2015/6, these product innovations along with deregulation has more than doubled the average Australian adults loss to $650 (Figure 3 shows this broken down by State) , and quadrupled gross profit to $12bn.
Figure 3 2015/6 Gaming Machines real expenditure per capita
Gaming Machine Turnover is a massive $142bn up from $23bn in 1990, and 4% of adult Australians (600,000) play gaming machines more than once a week. An estimated 95,000 Australians (0.6% of the adult population) are classified as Problem Gamblers, and it is estimated they are responsible for 40% of gaming machine turnover (Productivity Commission).
That average loss of $650, even the NSW loss of $1,023 shown in Figure 3 seems to obscure this imbalance.
Whilst the various State legislation requires gaming machines to pay out a minimum of 85% of turnover as winnings (Productivity Commission), anyone who has ever gambled knows that these winnings are not evenly distributed. How can we get a better sense of how much people in our communities are losing?
Firstly, turnover is a more accurate measure of how much money people put through the EGMs. This has increased 423% since 1990/91 from $1,812 per adult to $7,670 in 2015/6 .
But if 40% of turnover is contributed by 95k problem gamblers, how much is that per problem gambler?
Figure 4 Real Gaming Machine Turnover by Problem Gambler
$600k per problem gambler in 2015/6 (Figure 4), up from from $98k in 1990/1. At today’s prices in Sydney, that could mean up to 95,000 families lost their homes to playing the pokies.
There isn’t much other data available other than these averages, and even from simple maths, you can see the figures are quite devastating.
My goal is to convince national government policy makers, to change the way gaming machine losses are reported on. Gaming machines account for every dollar that flows in and out of them and are reported to the State for tax collection purposes.
State Governments must show a frequency histogram of the amount of gains and losses from these machines so our community understands the true cost to individuals, and just how rare a win is. Im sure it is even more than $600,000 for some people.
This way we will all learn the true cost of gaming machines to our society.
Context:
I needed to counter balance my last post with this one, against gaming machines!
My goal is to convince my target audience, national government policy makers, to change the way gaming machine losses are reported on. Gaming machines account for every dollar that flows in and out of them. We should be able to show a frequency histogram of the amount of gains and losses from these machines so society understands the true cost to individuals, and just how rare a win is. The medium for this article is an online blog.
My data is from the Australian Gambling Statistics 1990–91 to 2015–16, 33rd edition which is a survey conducted annually by the Queensland Government. The data comes in excel format, ready to use. I augmented this with data on the number of gaming machines in each state, combined with the Australian Government Productivity Commission’s Inquiry into Gambling from 2010.
Some definitions:
Gaming machines: All jurisdictions, except Western Australia, have
a state–wide gaming machine (poker machine) network operating in clubs and/or hotels. (WA only has machines in the Crown Casino, 1,750 of them). The data reported under this heading do not include gaming machine data from casinos. Gaming machines accurately record the amount of wagers played on the machines. So turnover is an actual figure for each jurisdiction. In most jurisdictions operators must return at least 85 per cent of wagers to players as winnings, either by cash or a mixture of cash and product.
Instant lottery: Commonly known as ‘scratchies’, where a player scratches a coating off the ticket to identify whether the ticket is a winner. Prizes in the instant lottery are paid on a set return to player and are based on the number of tickets in a set, the cost to purchase the tickets, and a set percentage retained by the operator for costs.
Expenditure (gross profit): These figures relate to the net amount lost or, in other words, the amount wagered less the amount won, by people who gamble. Conversely, by definition, it is the gross profit (or gross winnings) due to the operators of each particular form of gambling.